Do Wages Lead Inflation, or Lag Land-Driven Cost Pressures?
A local-data analysis of whether Canadian wage growth looks like the initiating source of inflation, or a delayed adjustment to prior housing, shelter, and cost-of-living pressure.
The Question
The usual public debate often collapses into a wage-price spiral story: wages rise, firms raise prices, inflation follows. This analysis tests a different timing story.
The empirical chain is credit and mortgage conditions first, housing and land prices second, shelter/rent/CPI pressure third, and wage growth last.
How To Read The Charts
All lines are either year-over-year growth rates or percentage-point changes. The zero line is not a target; it is the boundary between acceleration and decline. The key visual question is not whether two lines overlap perfectly, but whether pressure tends to appear upstream before wages adjust.
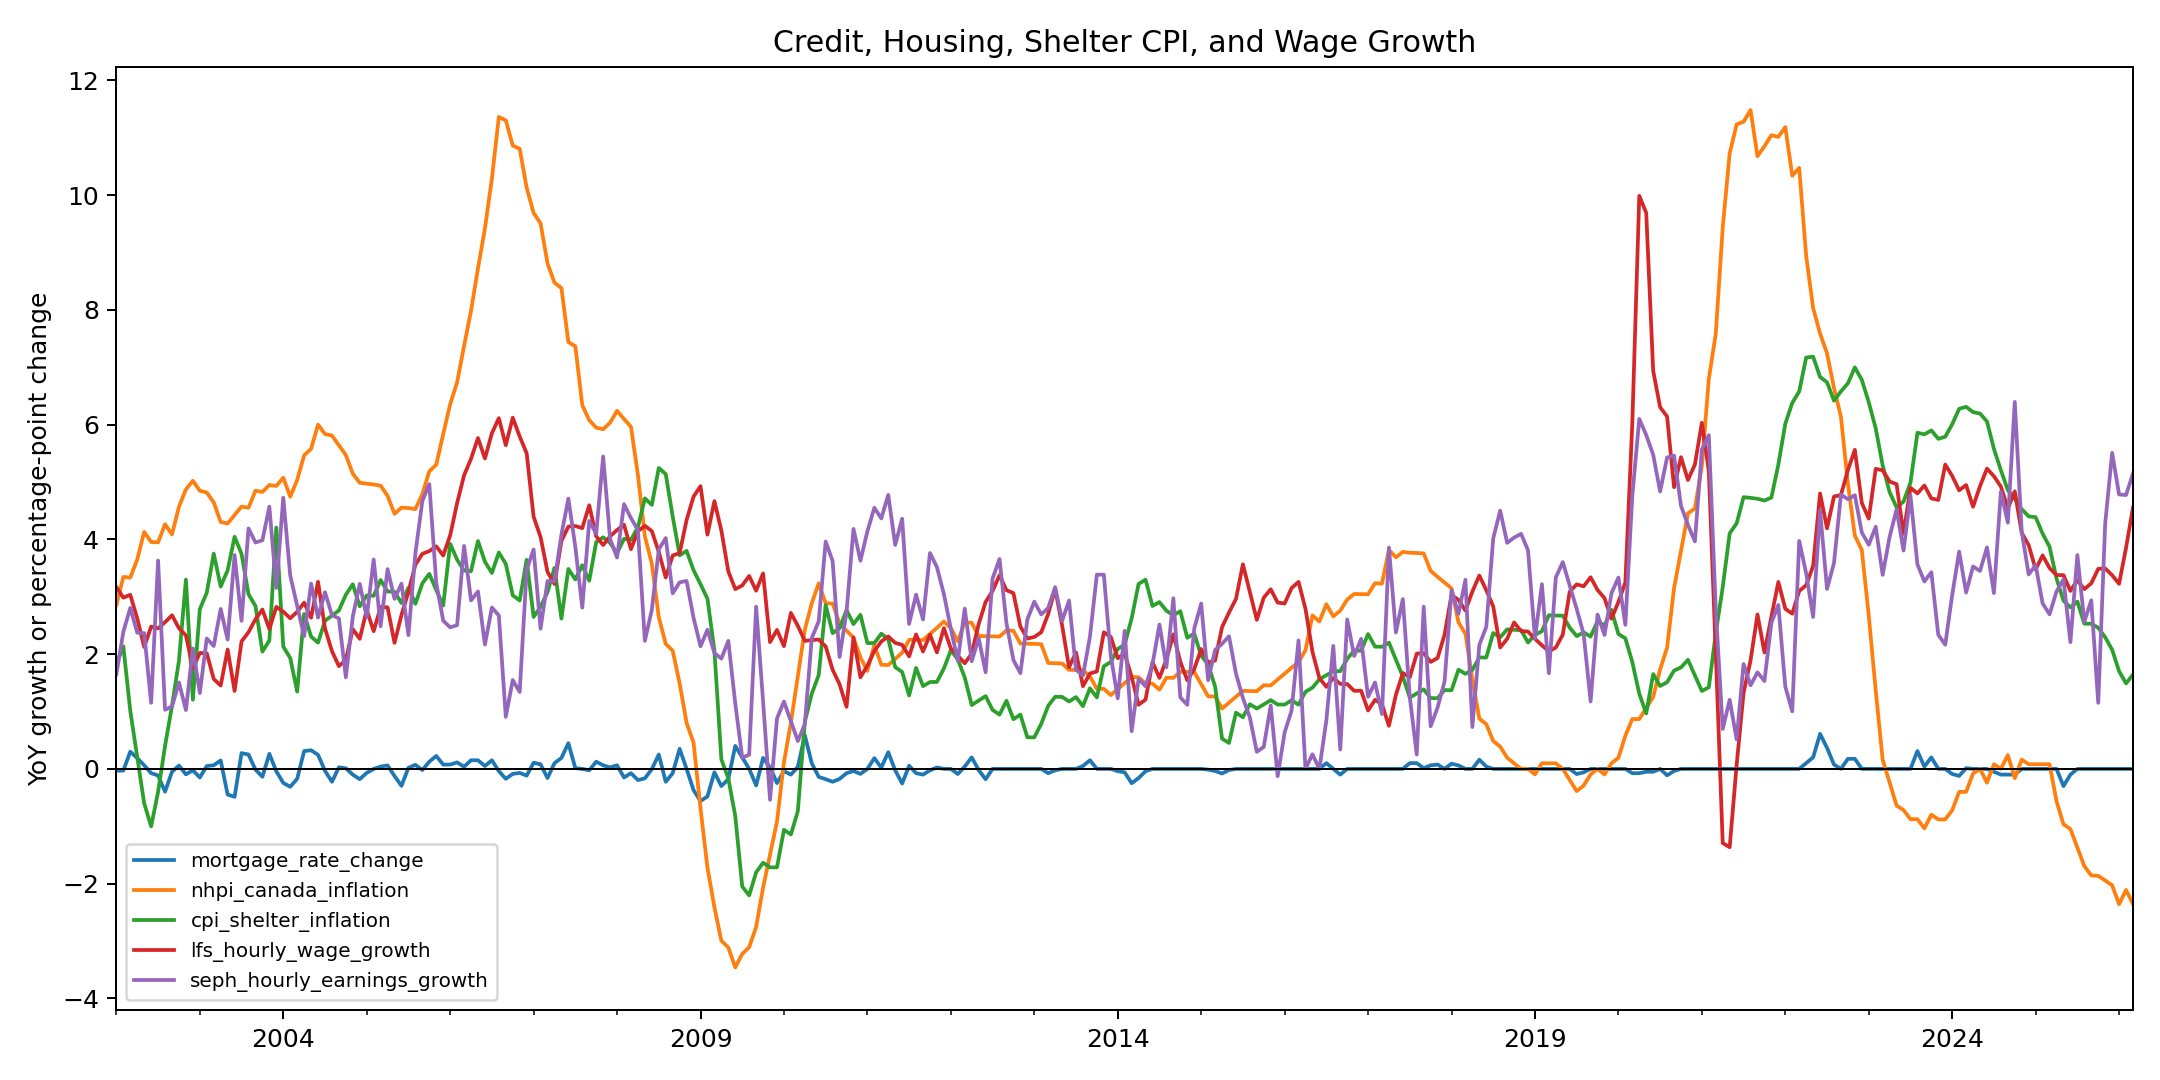
1. The Full Chain In One View
This overview puts mortgage-rate changes, NHPI inflation, CPI shelter inflation, and wage growth on the same timeline. It is intentionally broad: the goal is to see whether the system behaves like a sequence rather than a single simultaneous event.
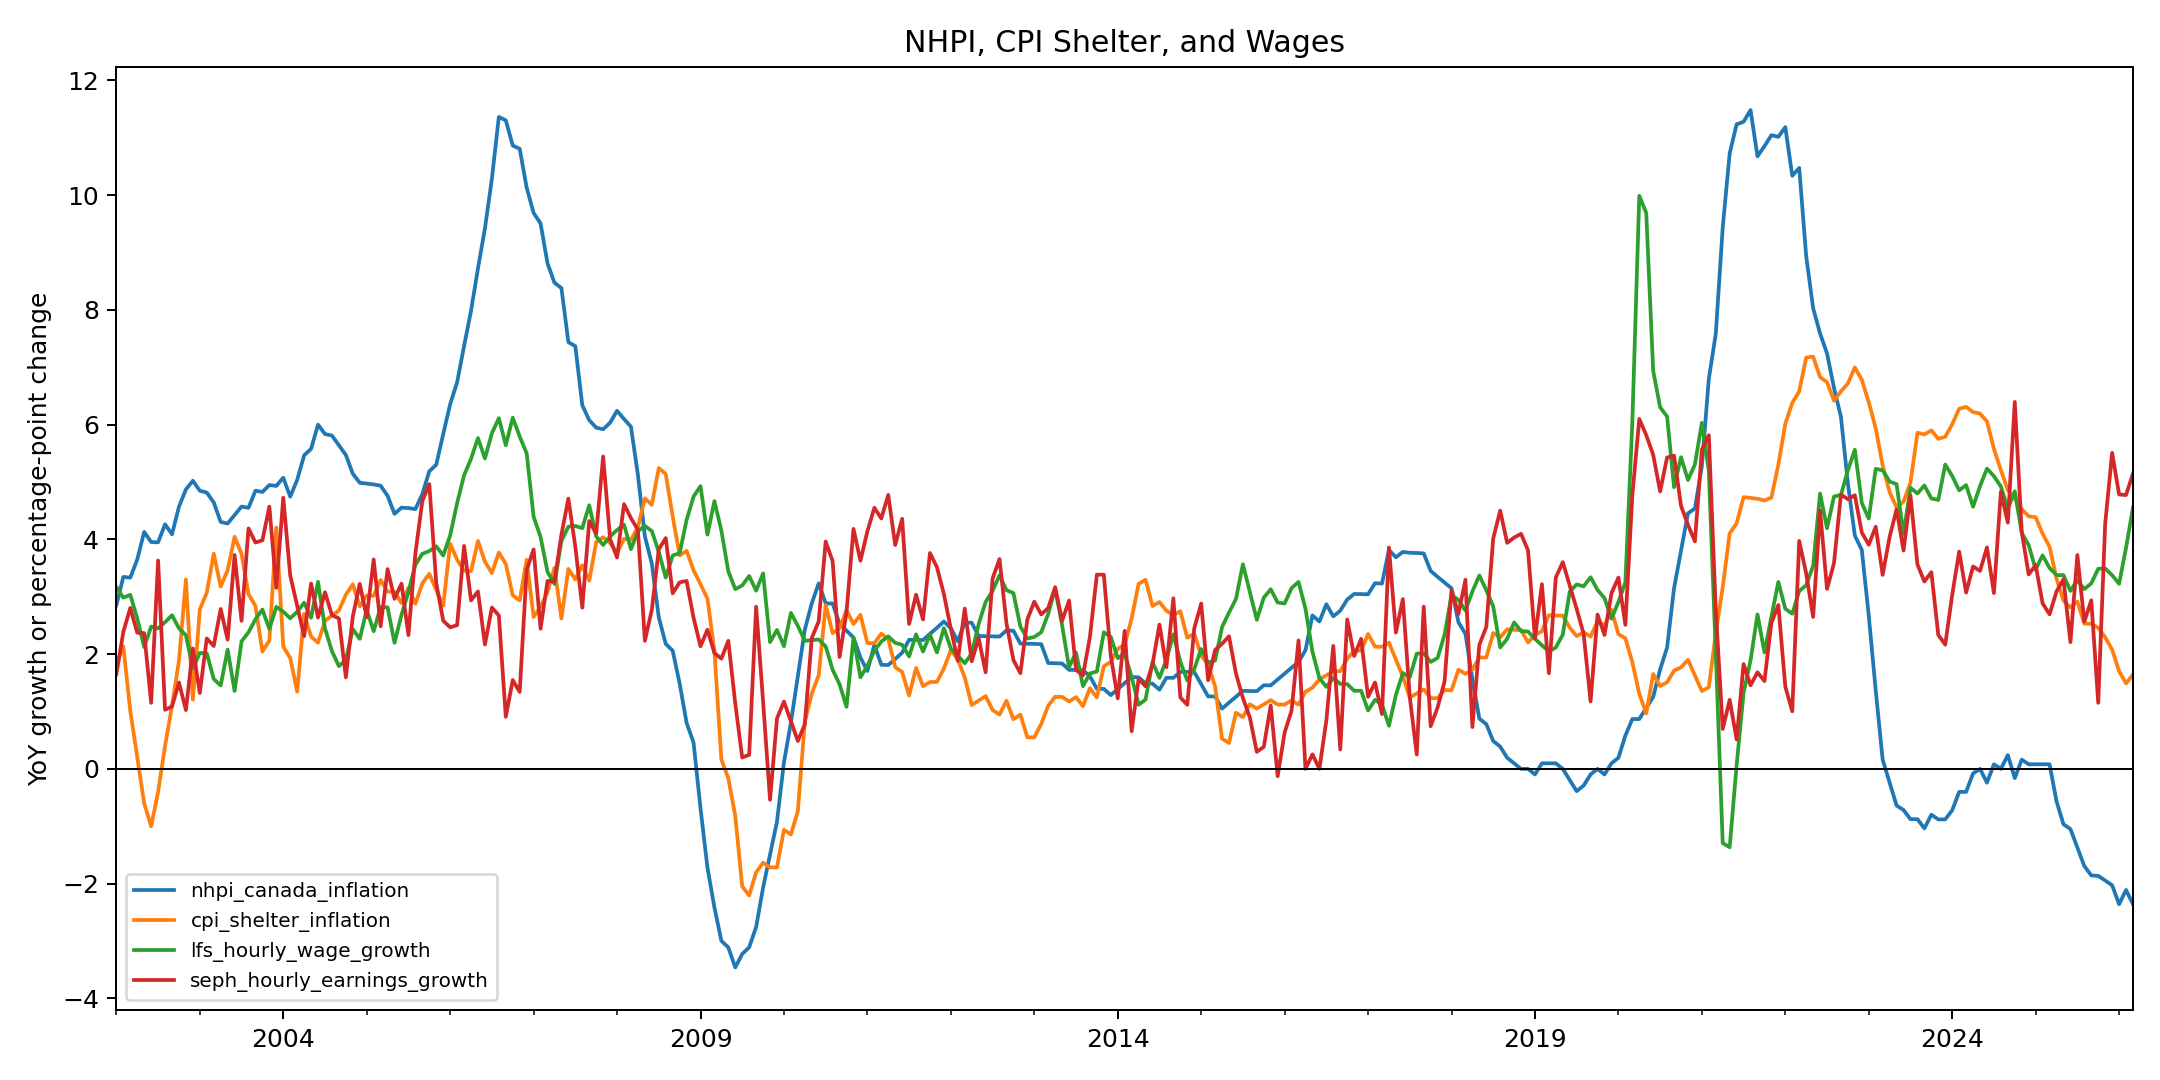
2. Housing Prices Before Shelter CPI Before Wages
The NHPI, shelter CPI, and wage chart is the clearest version of the proposed chain. Housing prices are treated as a state variable for the shelter-cost environment; wages are tested as a delayed adjustment to the cost of living.
| Link | Best predictor | Best target | Best lag | Correlation | N |
|---|---|---|---|---|---|
| Credit/rates -> housing | mortgage_credit_growth | nhpi_canada_inflation | 0 months | 0.559 | 423 |
| Housing -> shelter/rent CPI | nhpi_canada_inflation | cpi_mortgage_interest_inflation | 22 months | 0.628 | 510 |
| CPI shelter/rent -> wages | cpi_shelter_inflation | lfs_hourly_wage_growth | 12 months | 0.577 | 341 |
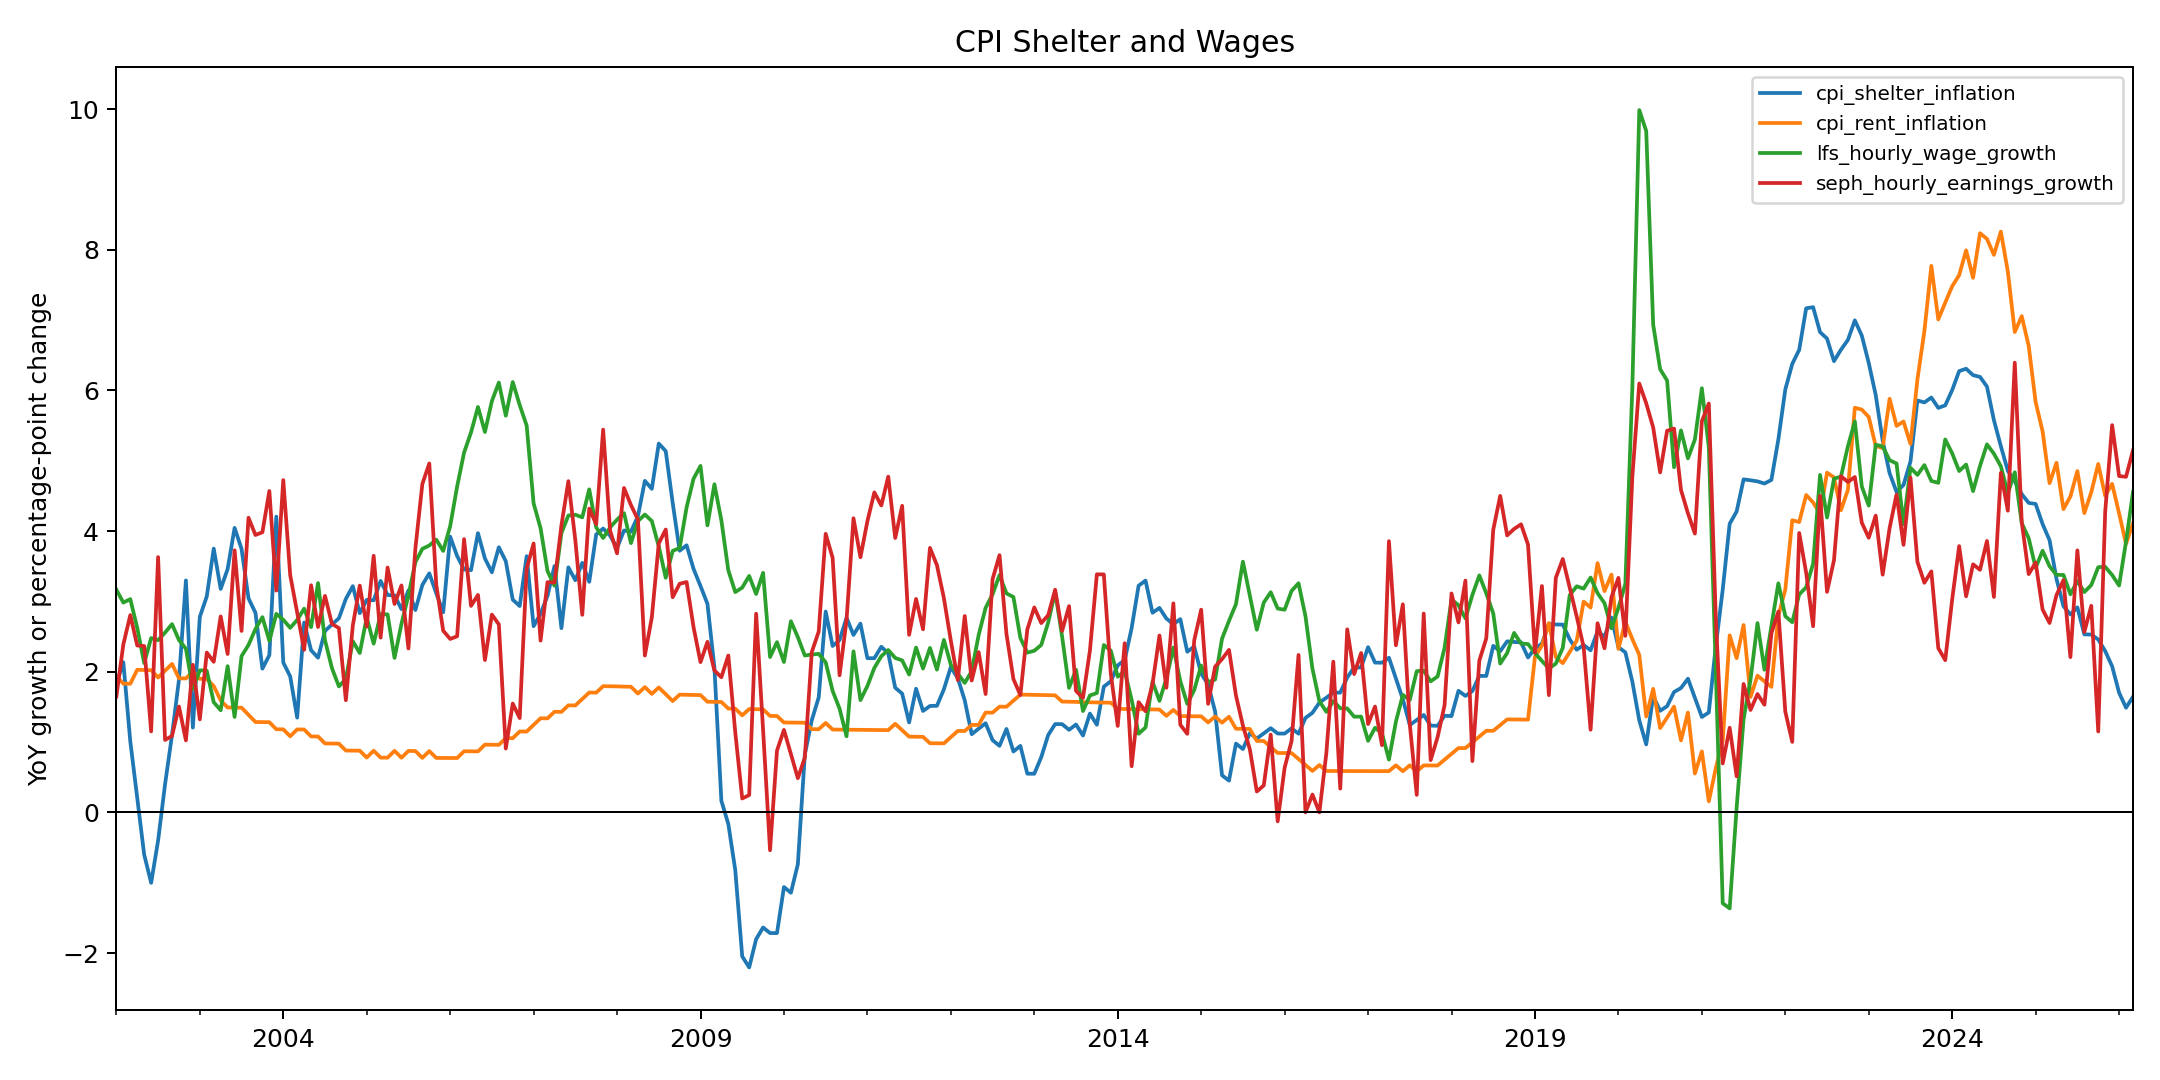
3. Shelter And Rent Pressure Against Wage Growth
This chart narrows the view to CPI shelter, CPI rent, and wage measures. The wage lines are noisier than price indexes, but the direction test asks a specific question: do shelter costs forecast wages better than wages forecast shelter costs?
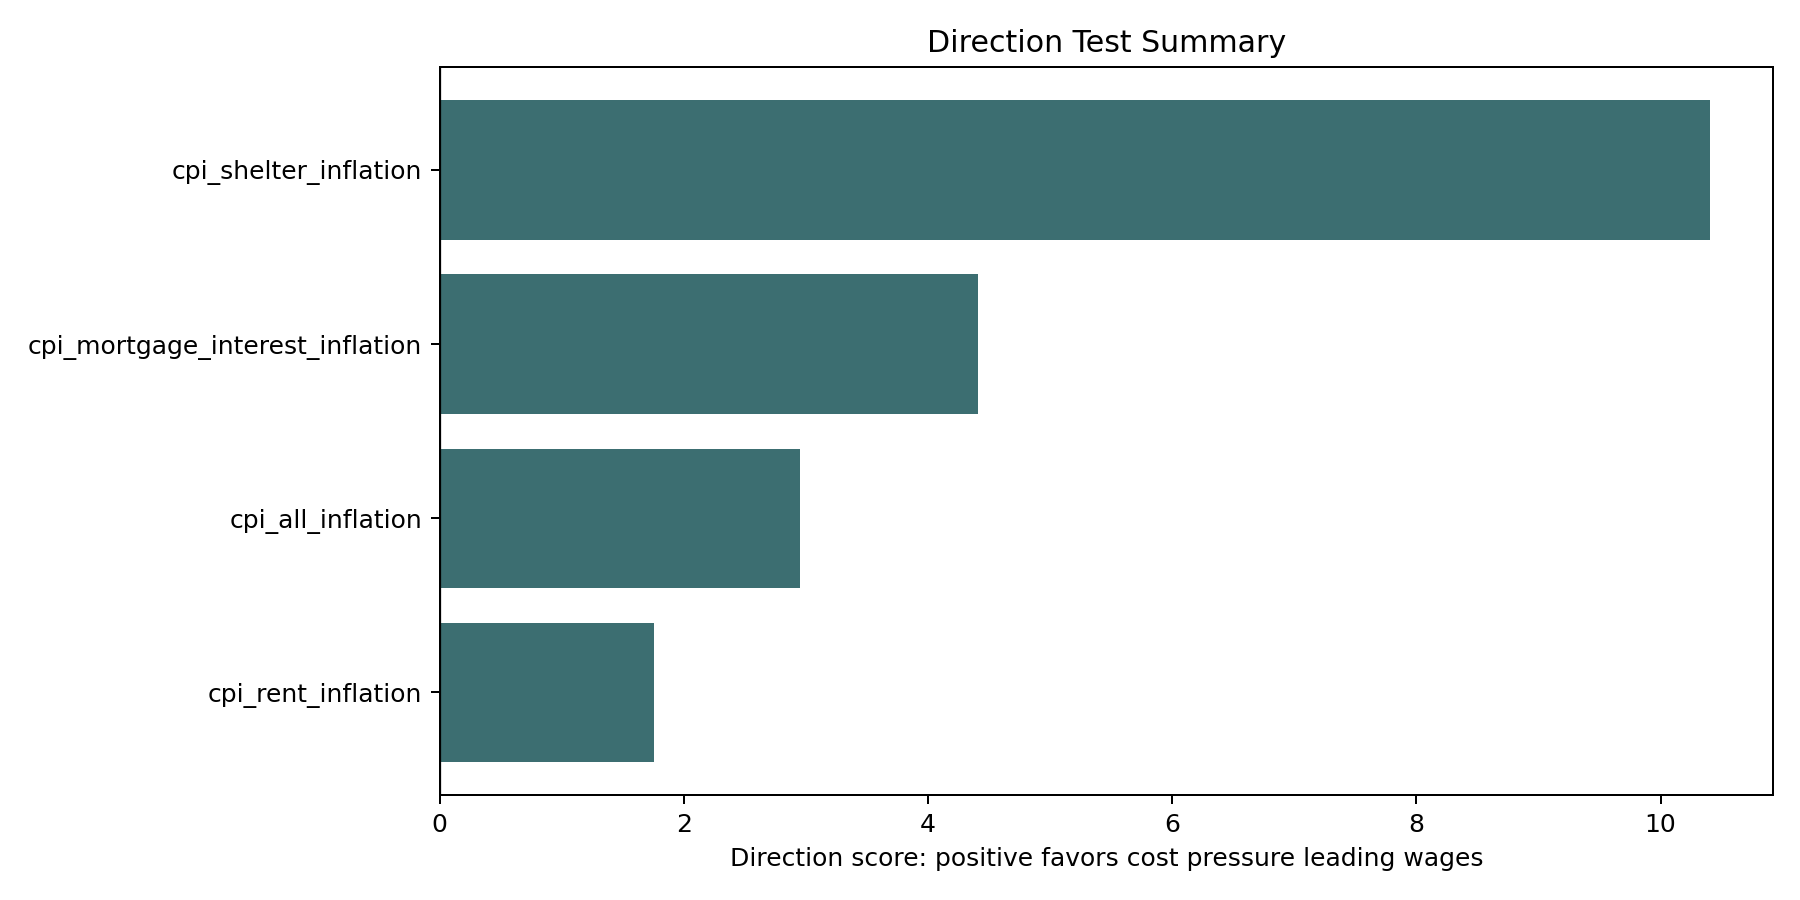
4. Direction Test: Wage-Led Or Wage-Lagged?
The central test compares two directions for each wage and cost measure: cost pressure leading wages, and wages leading cost pressure. Most combinations favor the delayed wage catch-up interpretation, though weekly earnings have two counterexamples.
| Wage measure | Cost pressure | Direction score | Read |
|---|---|---|---|
| SEPH hourly earnings | Mortgage-interest CPI | +18.7 | Strongly wage-lagged |
| LFS hourly wage | CPI shelter | +18.3 | Strongly wage-lagged |
| LFS hourly wage | All-items CPI | +9.5 | Wage-lagged |
| SEPH weekly earnings | Mortgage-interest CPI | -16.2 | Counterexample |
5. Regression Checks
The reduced-form regressions use lag choices suggested by the lead-lag scans and HAC/Newey-West standard errors. They are meant to check whether the sequence survives a more formal reduced-form setup.
| Model | Key term | Coefficient | p-value | Interpretation |
|---|---|---|---|---|
| NHPI inflation | mortgage_rate_change_lag0 | 3.569 | 0.00065 | Rate changes have predictive content for housing-price inflation in this specification. |
| NHPI inflation | credit_impulse_lag8 | 5.264 | 0.00042 | Credit impulse enters as an upstream housing variable. |
| CPI shelter inflation | nhpi_canada_inflation_lag19 | 0.180 | 0.00266 | Housing-price inflation predicts later shelter inflation. |
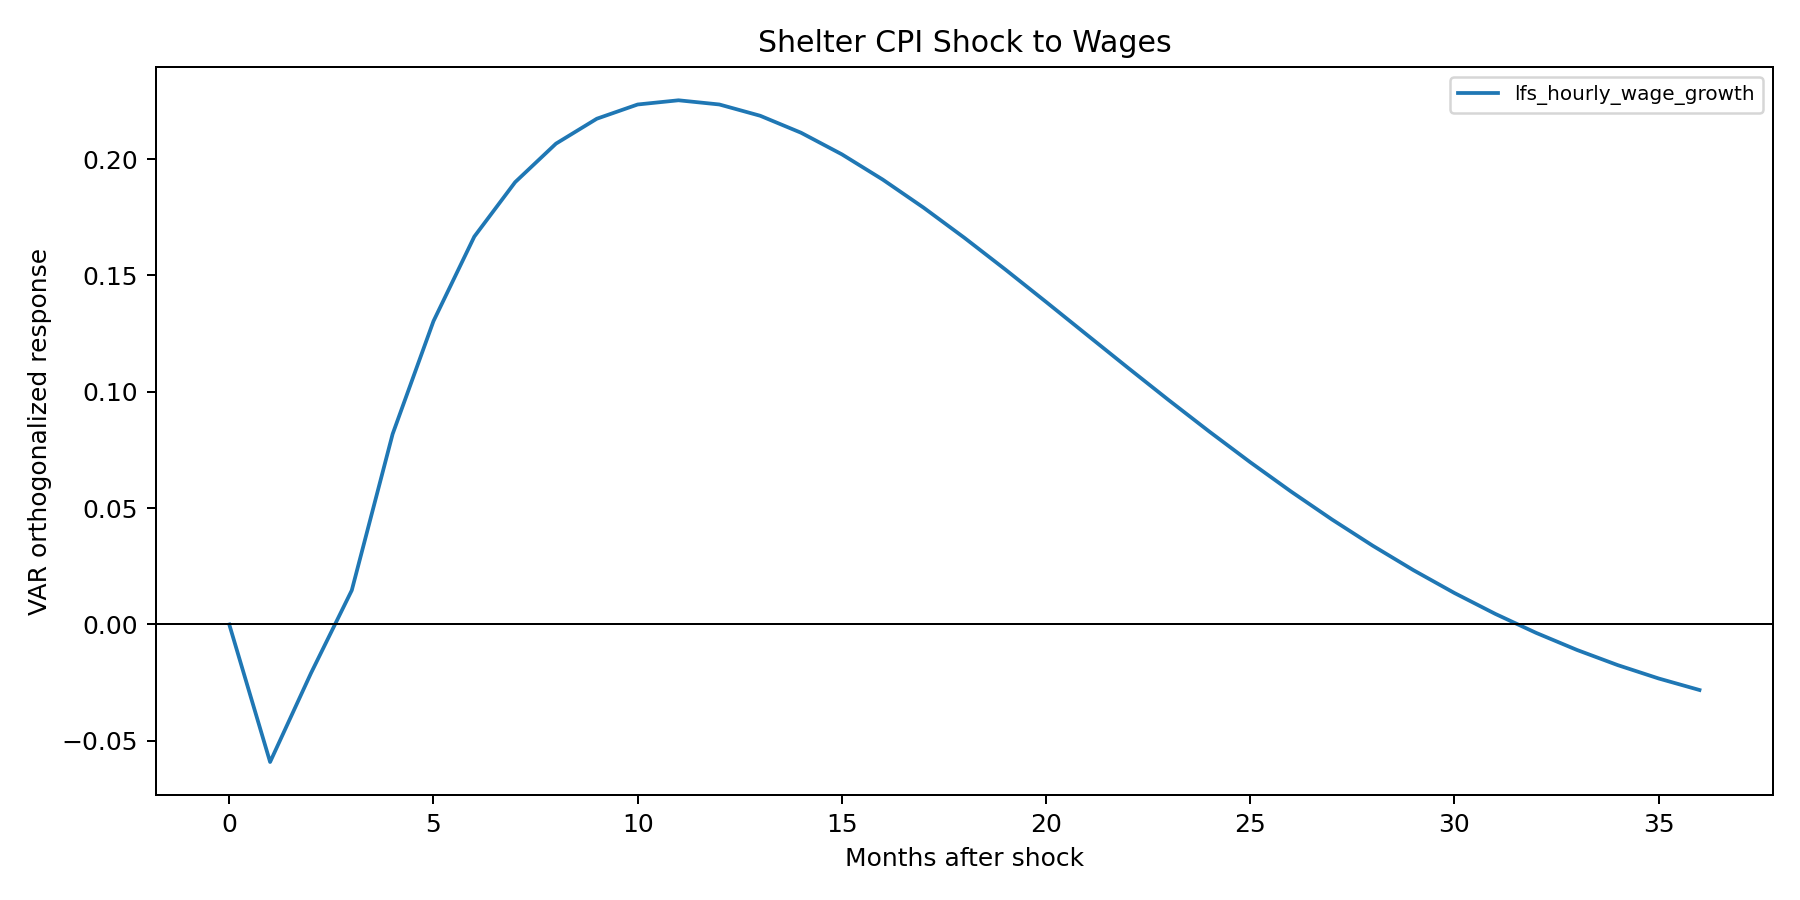
| LFS hourly wage growth | cpi_shelter_inflation_lag12 | 0.412 | 0.00004 | Shelter inflation predicts later wage growth. |
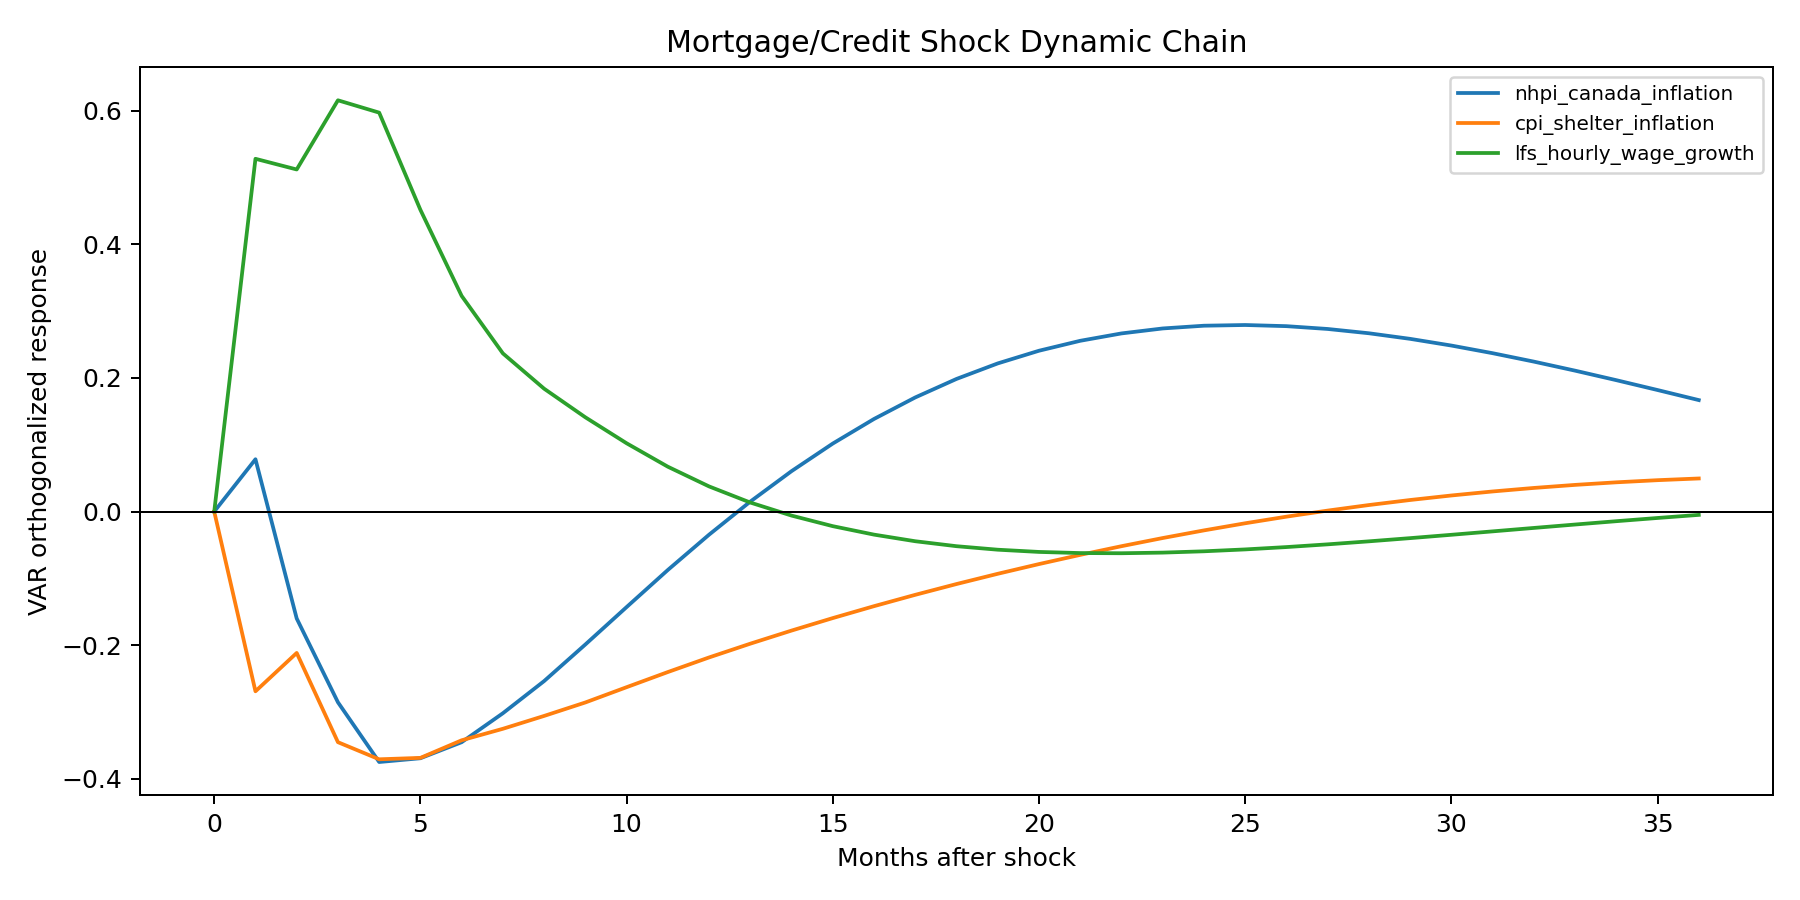
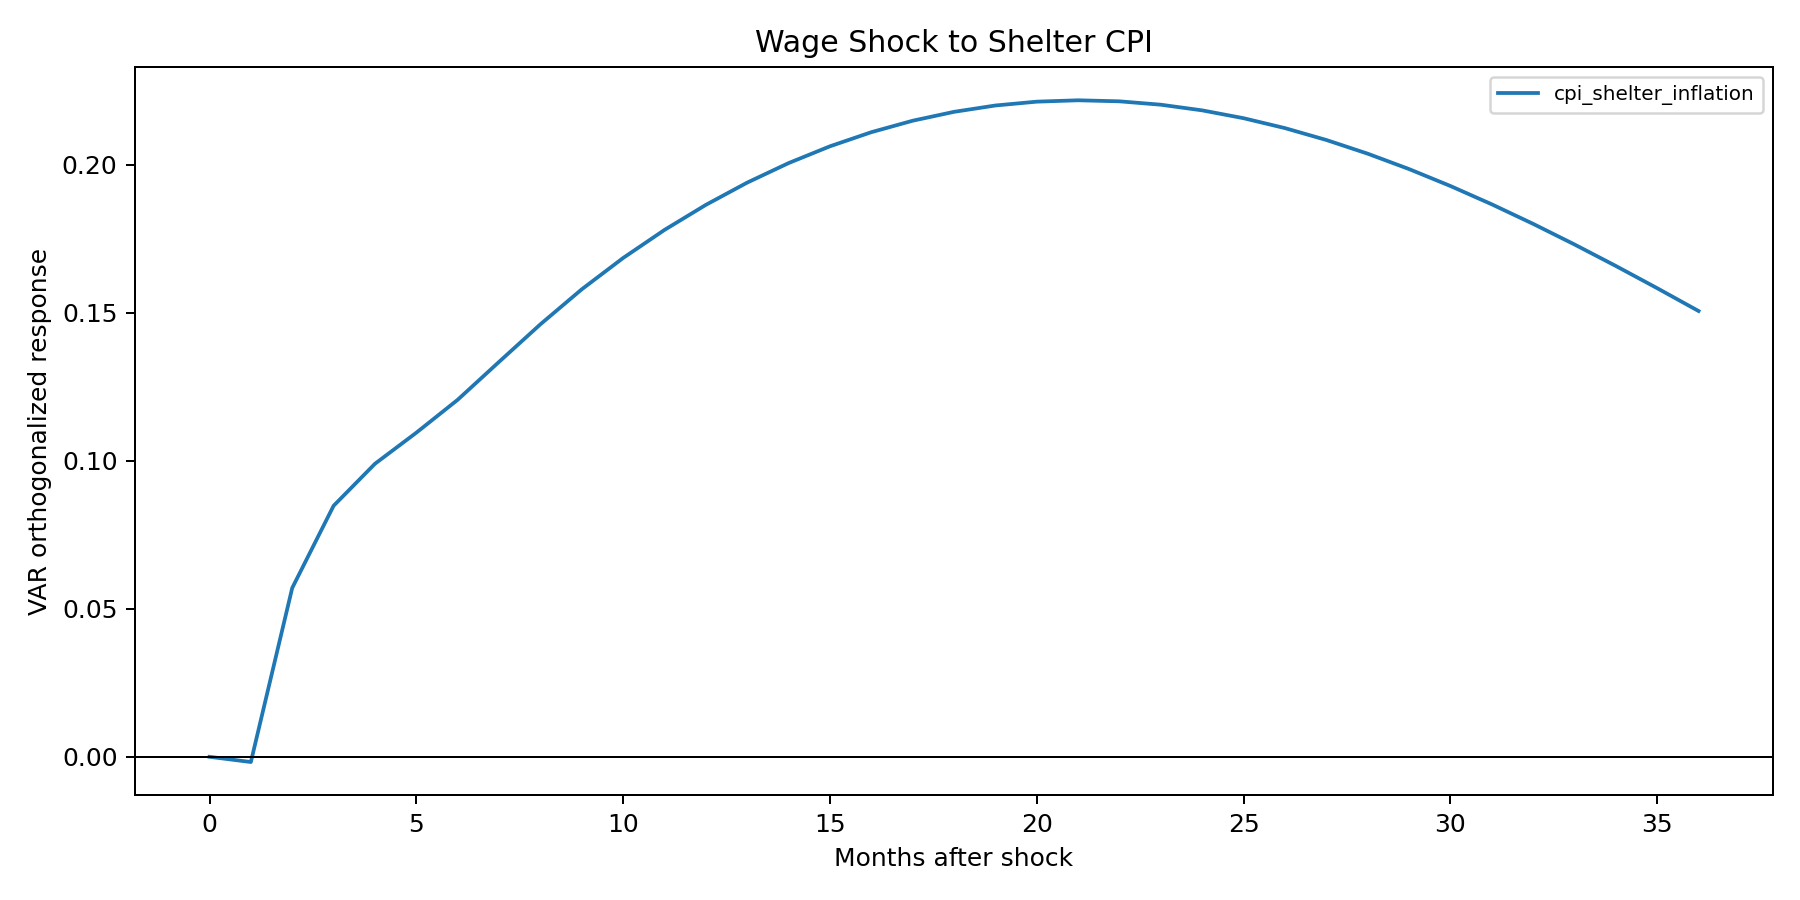
6. Dynamic Chain Model
The pipeline estimated a VAR for the preferred monthly variables. These impulse-response-style plots are not structural shocks, but they help visualize whether the dynamic ordering is consistent with the chain.
7. What This Does And Does Not Prove
The evidence supports a timing interpretation: wages look downstream of shelter and CPI pressure in forecasting tests. That is not the same as proving a structural causal model.
Suggested Twitter/X Thread Breakdown
Use the boxed sections above as screenshot panels. A practical thread would be 8 to 10 posts; each post should make one claim and attach one screenshot.